
Website speed isn’t about chasing a perfect score. It’s about making sure your content loads quickly – for real people, on real devices, in real conditions.
But it’s easy to misread test results. A single run on a fast desktop connection from halfway across the world doesn’t reflect what your users actually experience.
This guide shows you how to get meaningful insights from your speed tests. From key metrics to mobile simulation, we’ll help you measure what matters – and make changes that genuinely improve performance.
Why speed testing matters
A slow site frustrates visitors and costs you conversions. It also affects how search engines rank your pages. Testing regularly helps you catch issues early, track the impact of changes and ensure your site stays responsive across devices and locations.
Key metrics that matter
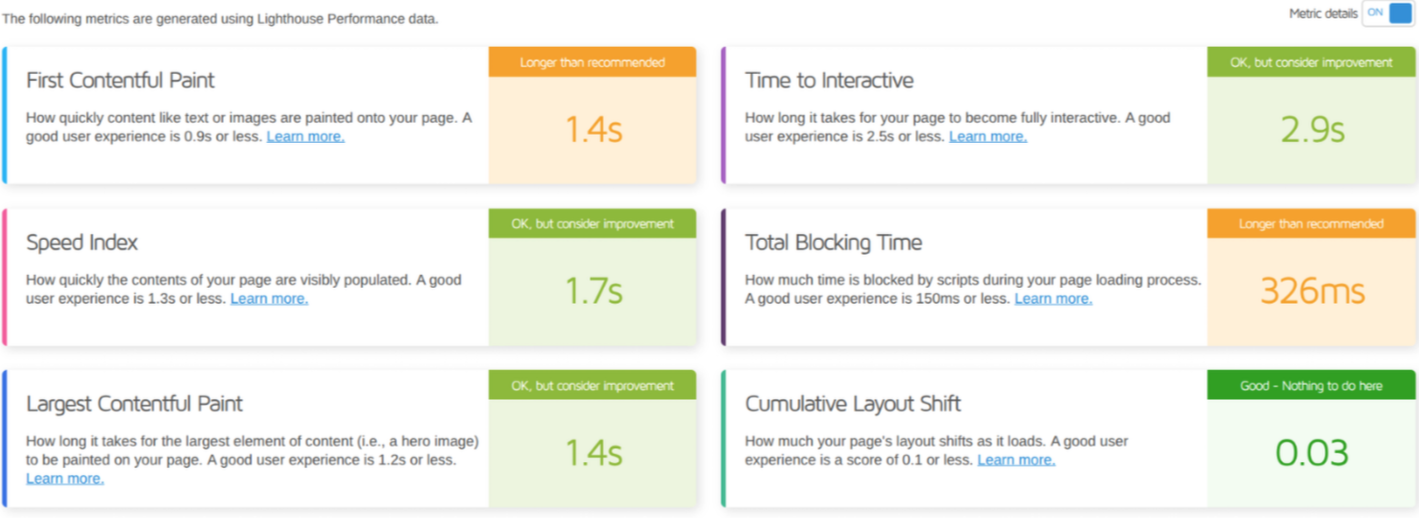
Forget chasing 100/100 scores. These are the metrics that actually tell you how your site performs:
Time to First Byte (TTFB) - How quickly your server starts to respond. High TTFB often means slow hosting or backend delays.
First Contentful Paint (FCP) - When something first appears. Gives the first impression of speed.
Largest Contentful Paint (LCP) - When the main content finishes loading. A key perception metric.
Cumulative Layout Shift (CLS) - Measures visual stability. High CLS = elements jumping around.
Total Blocking Time (TBT) or Interaction to Next Paint (INP) - How long the page is unresponsive due to JavaScript.
Together, they build a picture of how fast and usable your site feels. You’re aiming for smooth, not perfect.
Common misconceptions about speed testing
Speed tests are helpful – but they’re easy to misread. Here are some of the most common pitfalls that can lead you astray:
Chasing high scores - A high score doesn’t always mean a fast site. Some tools reward tweaks that don’t improve real-world load time.
Relying on one test - Speed varies by device, location, and time. Run multiple tests across different regions and devices to get a reliable view.
Fixing every warning - Not every suggestion matters. Some are cosmetic, others may even slow you down if implemented blindly.
Testing only the homepage - Product pages, blog posts and forms often behave very differently. Test across a range of page types.
Thinking caching solves everything - Caching helps, but it won’t fix bloated images, unoptimised scripts or slow database queries. It carries the load – it doesn’t reduce it.
Use more than one testing tool
Each tool offers a different perspective:
GTmetrix - gives you a clear waterfall chart, great for spotting what’s slowing you down.
PageSpeed Insights - focuses on Core Web Vitals, including real-world data from Chrome users.
WebPageTest - digs deeper with filmstrips, CPU usage and fine-grain controls.
Lighthouse - (built into Chrome DevTools) gives performance scores with code-level suggestions.
No single tool tells the whole story. The comparisons below show the same site tested with two different tools – with two different sets of results.
That’s why multiple tools give a more accurate picture.
Test on mobile, not just desktop
Most users visit your WordPress site on a phone, not a high-end desktop. A site that feels fast on a MacBook with Wi-Fi can crawl on a mid-range Android with mobile data.
To test mobile performance effectively:
Emulate real devices like a Moto G or iPhone 8 to reflect real-world hardware
Throttle connections to simulate 3G or slower 4G
Reduce CPU power to mimic older phones
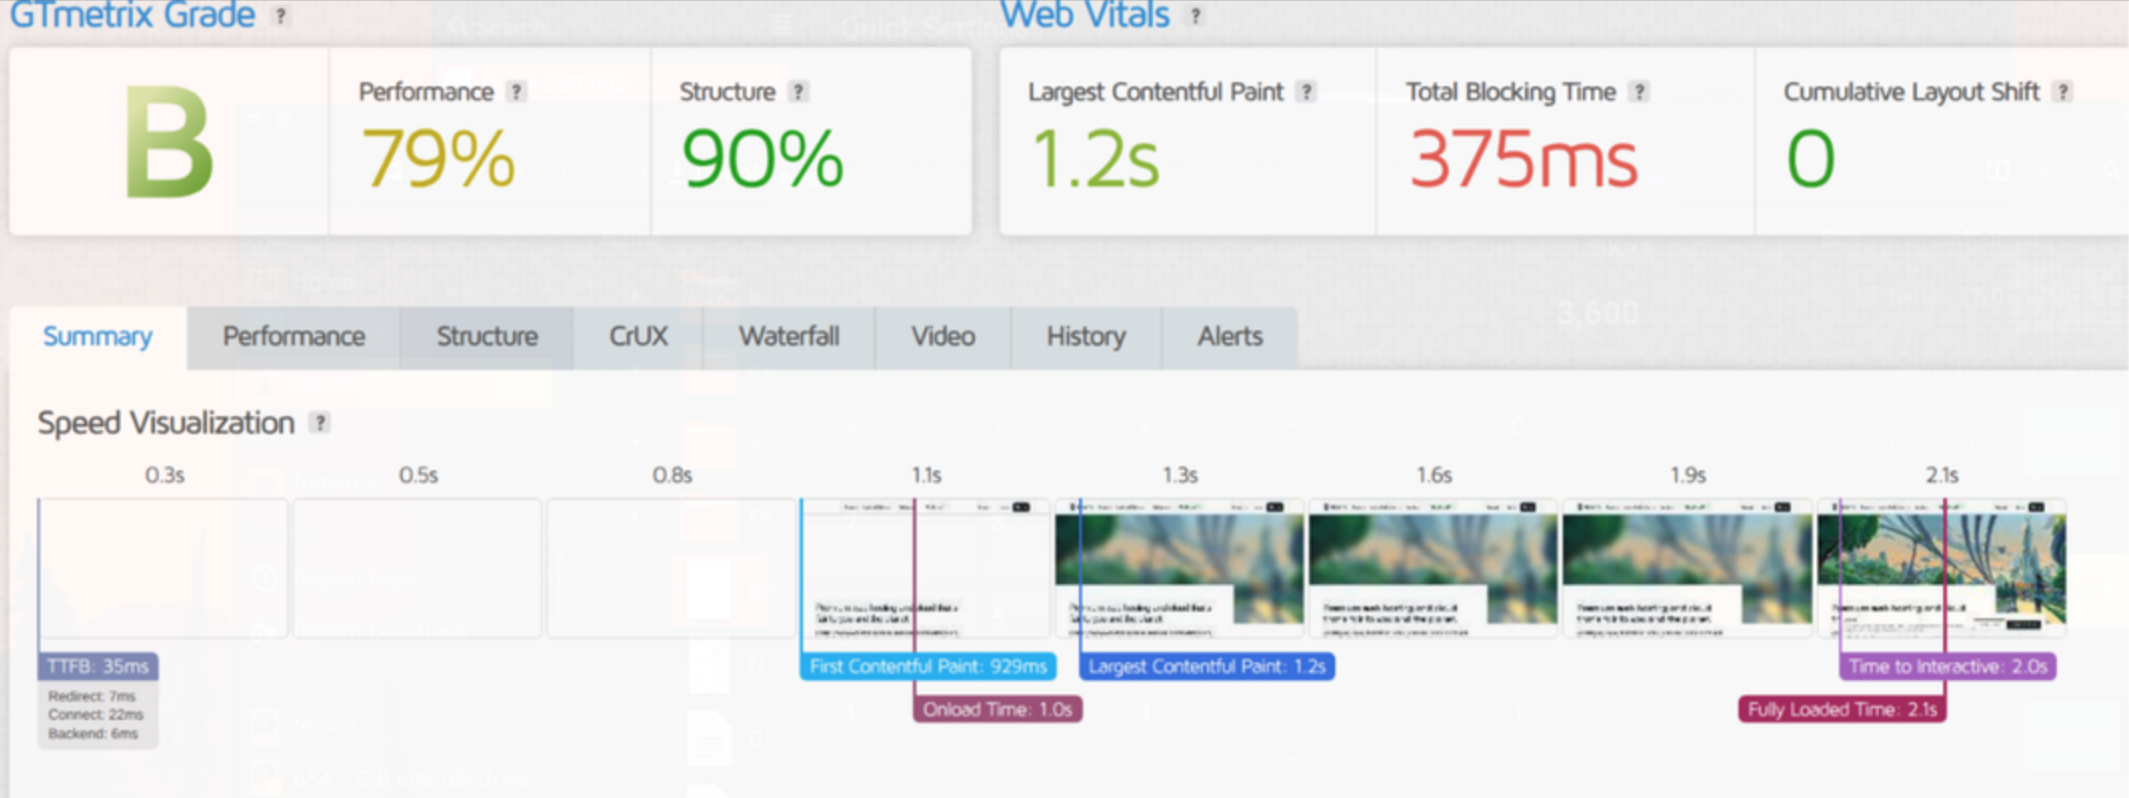
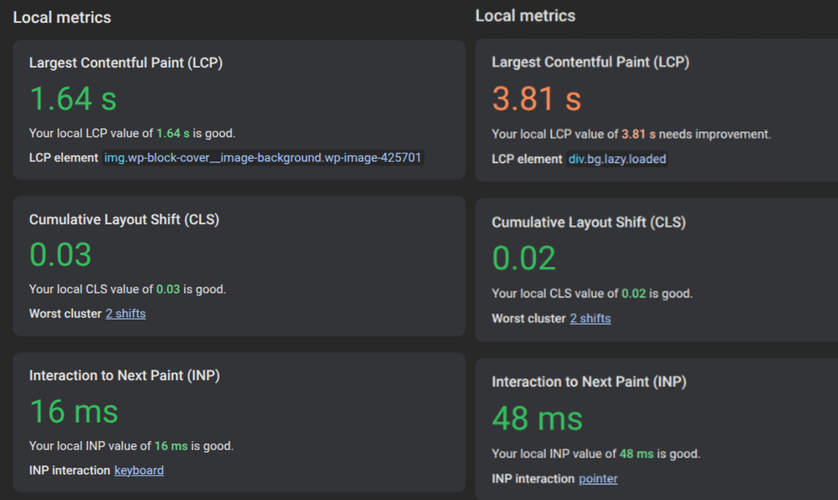
In the image below, the same site is tested on two mobile setups. On a slower device and connection, load time stretches to 6.6 seconds. On a faster one, it drops to 2.1 seconds. Same site, very different experience.
Slower device and connection:
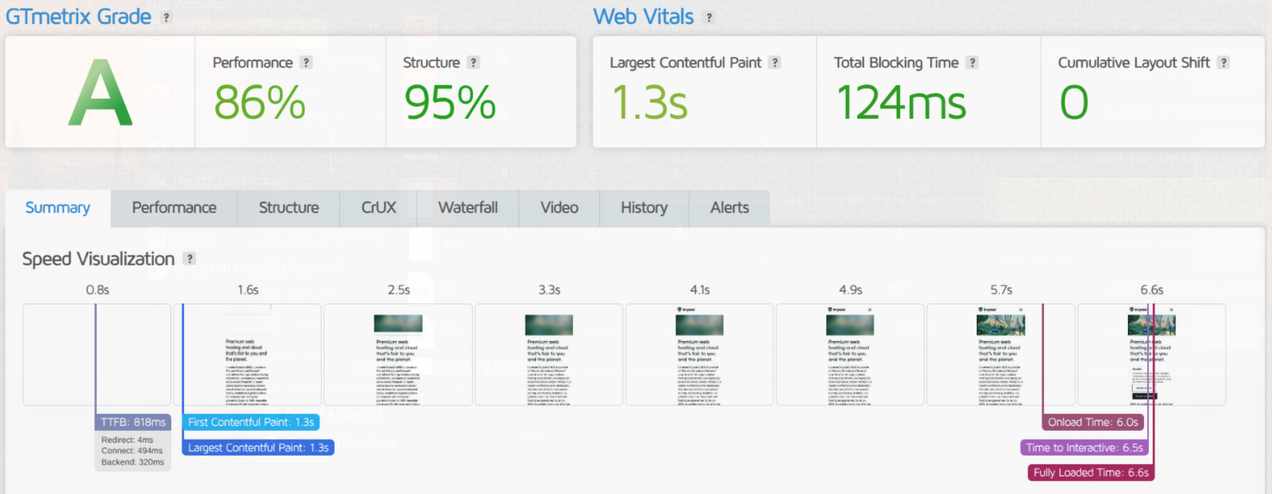
Faster device and connection:
Test from the right location
Where you test from matters. If most of your visitors are in the UK, run your tests from a UK-based server.
Testing from distant locations like the US or Asia adds latency, making your site seem slower than it really is for your users.
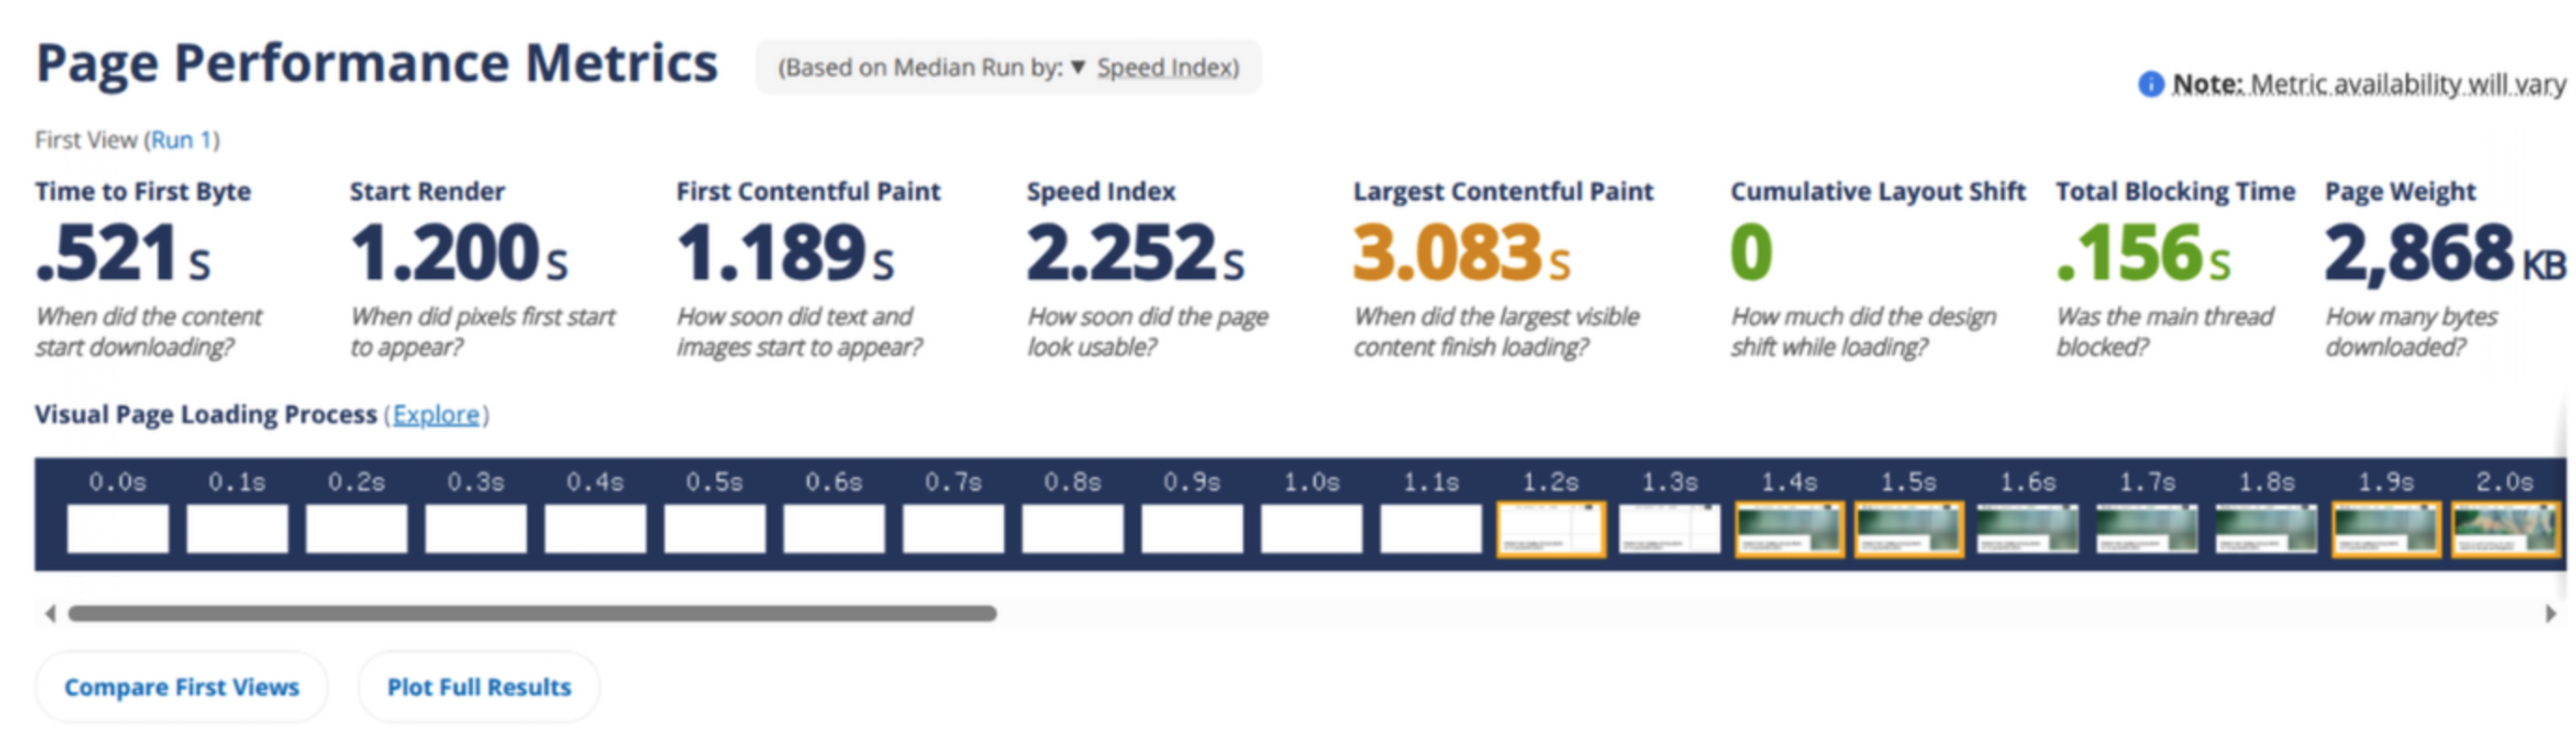
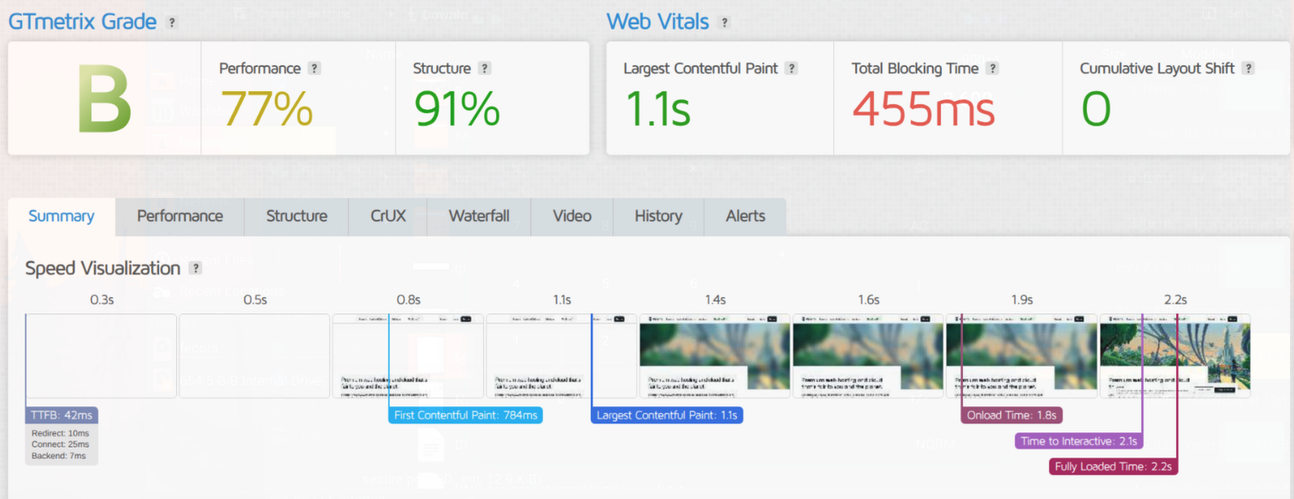
The comparison image below shows this in action: the same site tested from London and San Francisco. The UK test loads in just over 2 seconds. The US version takes over 3 seconds and scores much lower – purely due to distance.
London:
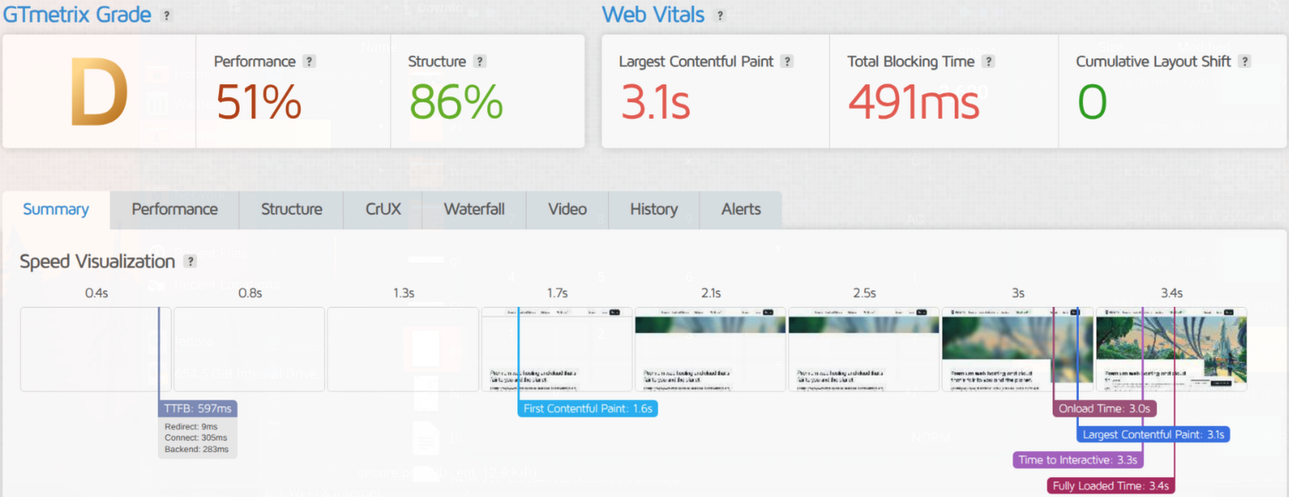
San Francisco:
Test both first-load and repeat-load
A first-load test shows how new users experience your site. A repeat-load test shows how returning visitors perform once caching kicks in.
Both matter. The first reflects new visitor impressions. The second shows how well your caching is working.
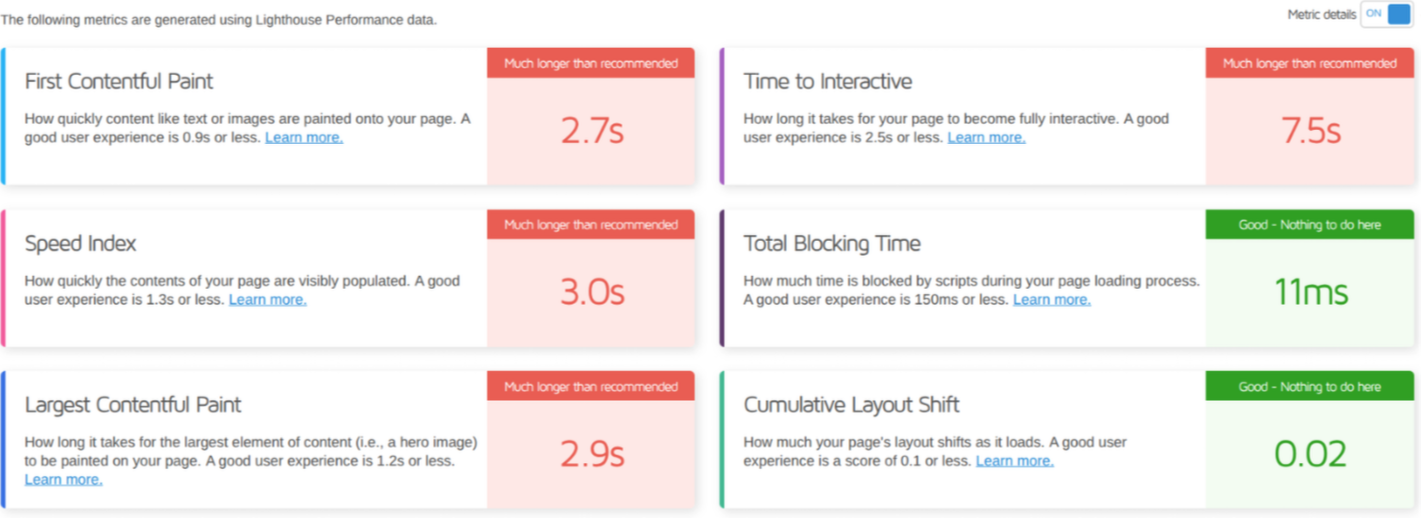
In this example, first load takes 5.82 seconds. The repeat load improves to 5.29 seconds. It’s a modest gain here, but on well-optimised sites, repeat load can be much faster.

Score isn’t everything
A perfect PageSpeed score might look good in a report, but it doesn’t always match user experience.
Focus instead on key metrics:
LCP - Improve by optimising large images, fonts, and critical CSS
TBT - Reduce by trimming JavaScript and breaking up long tasks
TTFB - Improve by choosing better hosting, optimising your database, and reducing plugin load
Improving these metrics makes your site feel faster and smoother. That matters more than a perfect number.
Test both logged-in and public views
WordPress often disables caching for logged-in users, making the experience slower for admins and customers. If you only test the public view, you might miss issues affecting logged-in visitors.
The side-by-side below shows this clearly: the logged-in version loads much slower, even though the design is the same. This highlights how background processes and dashboard tools can slow things down.
Watch the waterfall
If your site feels slow but scores well, the waterfall chart often explains why. It breaks down every file your browser loads and when.
Look out for:
Third-party scripts like chat tools or trackers delaying load
Render-blocking CSS or JavaScript
Failed requests or redirects
This deeper view often reveals issues the headline score doesn’t show.
Track performance over time
Website speed changes. Themes evolve, plugins update, content grows – and it all affects load times.
Regular testing helps you spot trends, track improvements, and identify when something starts to drag.
You can use:
WebPageTest for scheduled testing from various locations
SpeedVitals for continuous monitoring and trends
CrUX / PageSpeed API for real-world performance data
In the image below, one US-based test is a clear outlier in an otherwise stable set of results. If you’d only tested once, you’d miss that. Regular tracking builds a clearer, more reliable picture.

Always test before and after changes
Before you tweak a plugin, update your theme, or switch hosts – test your current performance. Then test again after. This lets you measure the true impact and avoid changes that make things worse.
It’s especially useful when:
Installing or updating plugins – some plugins introduce large scripts or third-party requests that slow things down
Changing themes – even lightweight themes can vary significantly in performance
Switching hosting providers – helps you validate whether the move actually improved load times
Enabling or disabling caching or CDNs – lets you measure the real impact of those tools on your site
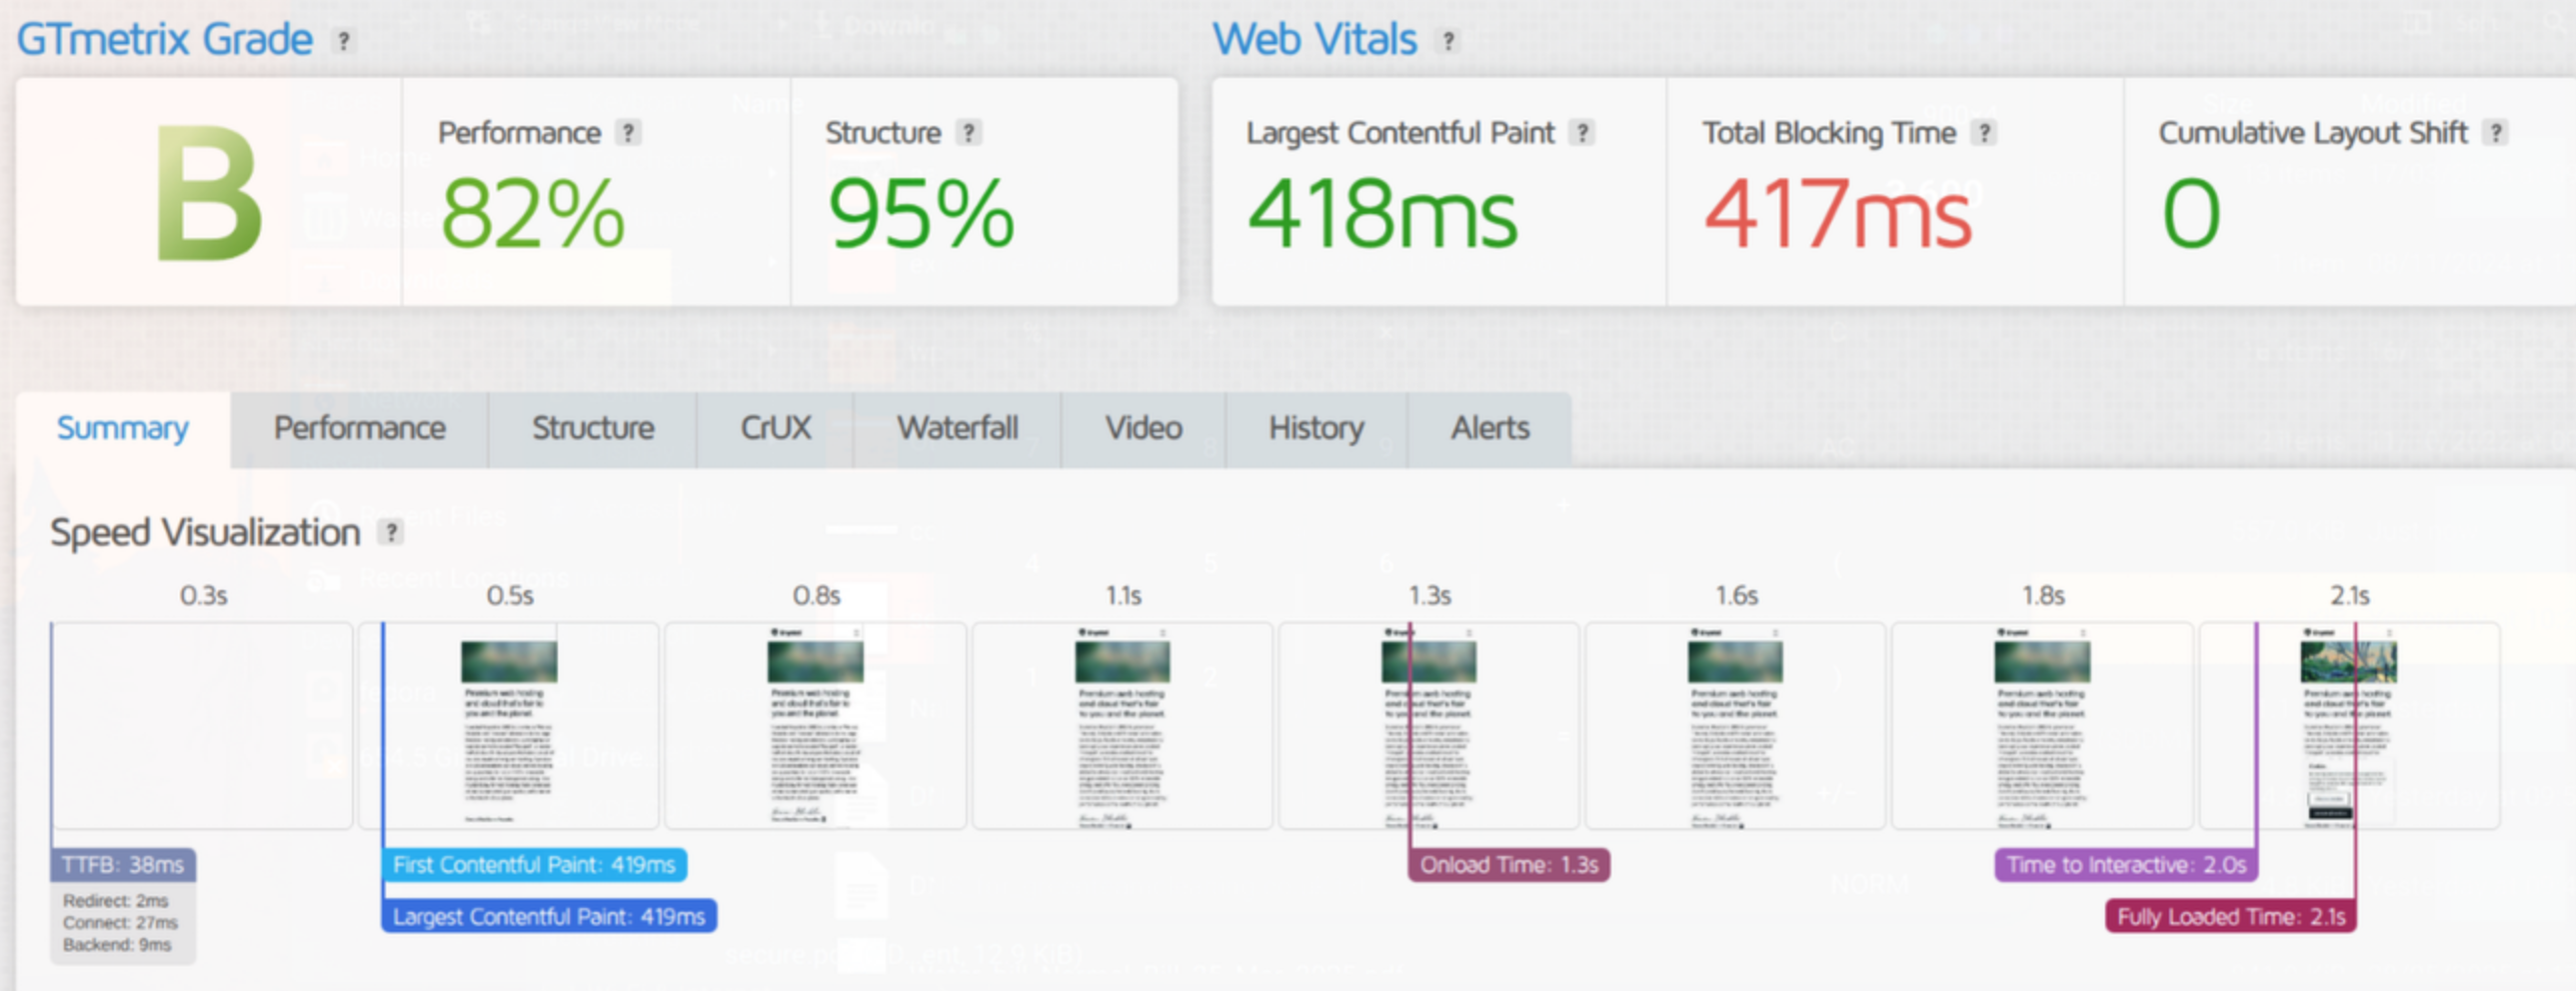
The image below compares the same site before and after a round of optimisation. With smarter caching, pruning, and tuning, every key metric improved significantly.
Before optimisation:
After optimisation:
Final thoughts
It’s easy to focus on the numbers. But speed testing isn’t about getting 100/100. It’s about building a site that feels fast and smooth to real people.
Use multiple tools. Test on mobile. From your users’ locations. Logged in and out. Test before and after changes so you can see what’s working. And monitor performance over time to catch slowdowns early. Consider upgrading your WordPress hosting to a faster, more-reliable provider (check out Krystal WordPress hosting, it's cloud-based for exceptional speed and reliability).
Finally, go beyond the score. Check your waterfalls. Watch your metrics. And focus on what really improves user experience.
Because that’s what optimisation really means: not chasing numbers, but building something that works better for the people who use it.
Share this article
About the author

Darren H
I'm Darren and I'm the Senior Copywriter at Krystal. Words are what I do. Aside from writing, I play guitar and sing in my band Machineries Of Joy and seek adventure with my wife and daughter.